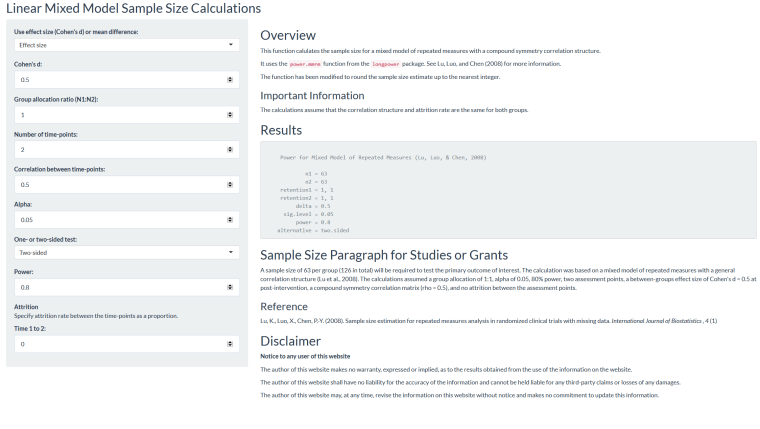
This post outlines a Shiny app to calculate the required sample size for a two-group linear mixed model.
It uses the power.mmrm function from the longpower package (see Lu, Luo, & Chen, 2008, for more information).
The input is simplified, whereby users are limited to five time-points, the correlation matrix is a compound symmetry correlation structure that is identical for both groups, and the attrition rate is assumed to be the same for both groups.
Shiny App
https://sammancuso.shinyapps.io/power
Code
The code is provided in case you want to run the code locally.
# Load the shiny and longpower packages
library(shiny)
library(shinythemes)
library(longpower)

# UI ----------------------------------------------------------------------
ui <- fluidPage(
    # Custom theme
    theme = shinytheme("cosmo"),
    # Add title
    titlePanel("Linear Mixed Model Sample Size Calculations"),

    # Add layout
    sidebarLayout(
        # Input
        sidebarPanel(
            strong("Effect size"),
            selectInput(
                "typeInput",
                p("Standardised mean difference (SMD) or mean difference"),
                choices = c("SMD", "Mean difference")
            ),
            conditionalPanel(
                condition = "input.typeInput == 'SMD'",
                numericInput(
                    "numDeltaES",
                    "SMD",
                    min = 0,
                    step = 0.1,
                    value = 0.5
                )
            ),
            conditionalPanel(
                condition = "input.typeInput == 'Mean difference'",
                numericInput(
                    "numDeltaMD",
                    "Mean difference",
                    min = 0,
                    step = 0.1,
                    value = 0.5
                ),
                numericInput("sdA",
                             "SD for Group A",
                             min = 0,
                             value = 1
                ),
                numericInput("sdB",
                             "SD for Group B",
                             min = 0,
                             value = 1
                )
            ),
            numericInput(
                "numLambda",
                "Group allocation ratio (N1:N2)",
                value = 1,
                min = 0.01,
                step = 0.1
            ),
            strong("Number of time-points"),
            numericInput(
                "numTime",
                p("Maximum of 5"),
                min = 2,
                max = 5,
                value = 2
            ),
            selectInput(
                "typeCorr",
                "Correlation structure",
                choices = c("Exchangeable", "First-order autoregressive: AR(1)")
            ),
            strong("Group A"),
            numericInput(
                "corTime1",
                p("Correlation between time-points"),
                min = 0.1,
                max = 0.9,
                step = 0.1,
                value = 0.5
            ),
            strong("Group B"),
            numericInput(
                "corTime2",
                p("Correlation between time-points"),
                min = 0.1,
                max = 0.9,
                step = 0.1,
                value = 0.5
            ),
            numericInput(
                "numAlpha",
                "Alpha",
                min = 0,
                max = 1,
                step = 0.01,
                value = 0.05
            ),
            selectInput(
                "sideInput",
                "One- or two-sided test",
                choices = c("Two-sided", "One-sided")
            ),
            numericInput(
                "numPower",
                strong("Power"),
                min = 0.8,
                max = 1,
                step = 0.1,
                value = 0.8
            ),
            # Attrition
            strong("Attrition"),
            p("Specify attrition rate between the time-points as a proportion"),
            conditionalPanel(
                condition = "input.numTime >= 2",
                numericInput(
                    "numAttr1",
                    "Time 1 to 2",
                    min = 0,
                    max = 0.99,
                    step = 0.1,
                    value = 0
                )
            ),
            conditionalPanel(
                condition = "input.numTime >= 3",
                numericInput(
                    "numAttr2",
                    "Time 1 to 3",
                    min = 0,
                    max = 0.99,
                    step = 0.1,
                    value = 0
                )
            ),
            conditionalPanel(
                condition = "input.numTime >= 4",
                numericInput(
                    "numAttr3",
                    "Time 1 to 4",
                    min = 0,
                    max = 0.99,
                    step = 0.1,
                    value = 0
                )
            ),
            conditionalPanel(
                condition = "input.numTime == 5",
                numericInput(
                    "numAttr4",
                    "Time 1 to 5",
                    min = 0,
                    max = 1,
                    step = 0.1,
                    value = 0
                )
            )
        ),

        # Output
        mainPanel(
            h2("Overview"),
            tags$p(
                "This function calulates the sample size for a mixed model of repeated measures with an exchangeable or first-order autoregressive (AR[1]) correlation structure."
            ),
            tags$p(
                "For an independence correlation structure, set the correlation to 0."
            ),
            tags$p(
                "It uses the",
                tags$code("power.mmrm"),
                "function from the",
                tags$a(tags$code("longpower"), href = "https://cran.r-project.org/web/packages/longpower/index.html"),
                "package. See Lu, Luo, and Chen (2008) for more information."),
            tags$p("The function has been modified to round the sample size estimate up to the nearest integer."),
            h3("Important Information"),
            tags$p("The calculations assume that both the correlation structure and the attrition rate is the same for both groups."),
            h2("Results"),
            tags$p(textOutput("corrstructure")),
            verbatimTextOutput("console"),
            h3("Correlation structure for Group A"),
            verbatimTextOutput("corrmatrix1"),
            h3("Correlation structure for Group B"),
            verbatimTextOutput("corrmatrix2"),
            h2("Reference"),
            tags$p(
                "Lu, K., Luo, X., Chen, P.-Y. (2008). Sample size estimation for repeated measures analysis in randomized clinical trials with missing data.",
                tags$i("International Journal of Biostatistics"), ", ", tags$i("4"), "(1)"
            ),
            h2("Disclaimer"),
            tags$p(tags$b("Notice to any user of this application.")),
            p("The author of this application makes no warranty, expressed or implied, as to the results obtained from the use of the information on the website."),
            p("The author of this application may, at any time, revise the information on this website without notice and makes no commitment to update this information.")

        ),
    )
)

# Server ------------------------------------------------------------------
server <- function(input, output, session) {
    # Updates the attrition so it's equal to the previous timepoint
    # Done before user specifies the value

    observe({
        numAttr1 <- as.numeric(input$numAttr1)
        numAttr2 <- as.numeric(input$numAttr2)
        numAttr3 <- as.numeric(input$numAttr3)
        numAttr4 <- as.numeric(input$numAttr4)

        workcorr <- ifelse(as.character(input$typeCorr) == "First-order autoregressive: AR(1)", "AR(1)", "exchangeable")

        if (numAttr2 < numAttr1) {
            updateNumericInput(session, "numAttr2", value = numAttr1)
        }

        if (numAttr3 < numAttr2) {
            updateNumericInput(session, "numAttr3", value = numAttr2)
        }

        if (numAttr4 < numAttr3) {
            updateNumericInput(session, "numAttr4", value = numAttr3)
        }
    })

    powerout <- reactive({

        rho1 <- as.numeric(input$corTime1)
        rho2 <- as.numeric(input$corTime2)
        k <- as.numeric(input$numTime)
        lambda <- as.numeric(input$numLambda)
        corrtype <- ifelse(as.character(input$typeCorr) == "First-order autoregressive: AR(1)", "AR(1)", "exchangeable")

        # Input type
        if (as.character(input$typeInput) == "Mean difference") {
            delta <- as.numeric(input$numDeltaMD)
            # Standard deviations
            sigmaa <- as.numeric(input$sdA)
            sigmab <- as.numeric(input$sdB)
        } else {
            delta <- as.numeric(input$numDeltaES)
            # Standard deviations
            sigmaa <- 1
            sigmab <- 1
        }


        # Correlation matrix

        if (corrtype == "AR(1)") {

            # Auto-regressive function
            ar1_cor <- function(n, rho) {
                exponent <- abs(
                    matrix(1:n, nrow = n, ncol = n, byrow = TRUE ) - (1:n)
                )

                rho^exponent
            }

            Ra <- ar1_cor(k, rho1)
            Rb <- ar1_cor(k, rho2)


        } else {

            Ra <- matrix(
                rho1,
                nrow = k,
                ncol = k
            )

            Rb <- matrix(
                rho2,
                nrow = k,
                ncol = k
            )

        }

        diag(Ra) <- 1
        diag(Rb) <- 1

        # Delta
        power <- as.numeric(input$numPower)
        sig.level <- as.numeric(input$numAlpha)
        alternative <- ifelse(input$sideInput == "Two-sided",
                              "two.sided",
                              "one.sided"
        )

        # Attrition vector
        ra <- vector("numeric", length = k)

        for (i in 1:k) {
            if (i == 1) {
                ra[i] <- 1
            } else {
                ra[i] <- 1 - input[[paste0("numAttr", i - 1)]]
            }
        }

        samp <- power.mmrm(
            N = NULL,
            Ra = Ra,
            Rb = Rb,
            ra = ra,
            rb = ra,
            delta = delta,
            sigmaa = sigmaa,
            sigmab = sigmab,
            power = power,
            sig.level = sig.level,
            lambda = lambda,
            alternative = alternative
        )

        # Round up the sample sizes to nearest integer
        samp$n1 <- ceiling(samp$n1)
        samp$n2 <- ceiling(samp$n2)

        workingcor <- Ra

        return(
            list(
                samp = samp,
                Ra = Ra,
                Rb = Rb
            )
        )

    })


    # Specify the correlation structure
    output$corrstructure <- renderPrint({

        workcorr <- ifelse(input$typeCorr == "First-order autoregressive: AR(1)", "AR(1)", "exchangeable")


        cat("The sample size calculations below assume an ", workcorr, " correlation structure for both groups.", sep = "")
    })

    # Display output from powr.mrmm
    output$console <- renderPrint({
        powerout()$samp
     })

    output$corrmatrix1 <- renderPrint({
        powerout()$Ra
    })

    output$corrmatrix2 <- renderPrint({
        powerout()$Rb
    })
}

shinyApp(ui, server)

You must be logged in to post a comment.